The logic behind every AI try-on app seems airtight: if trying a hairstyle costs nothing, people should try more. A digital avatar can take a buzz cut at zero risk. So why does the data look like a comfortable hair appointment?
Because we measured 10,000 completed generation events inside WigTryAI and the pattern is clear: lower commitment changed how freely people explored, not how far they went.
What the Dataset Shows
This analysis comes from the 2026 AI Hairstyle Trends Report, built on 10,000 completed generation events recorded inside WigTryAI. The unit of analysis is one completed generation — not 10,000 unique people, not preferences, and not purchases. A person can generate several looks in one session, so the numbers describe exploration activity, not a survey of users.
Three numbers paint the pattern:
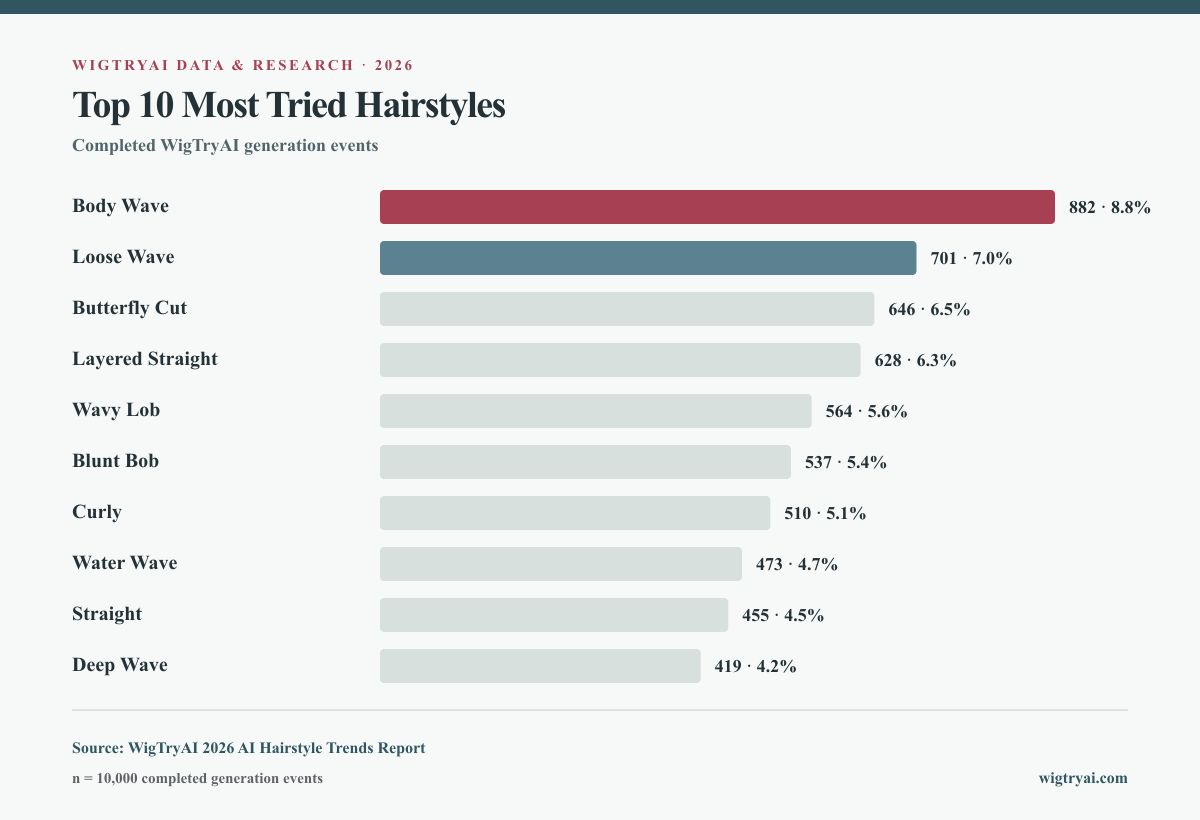
- Body Wave was the single most generated style with 882 events (8.8%) — the highest share in the dataset, but still under 10%.
- Wave styles were the largest family at 2,475 events (24.8%), and bobs added 2,047 more (20.5%) — together, 4,522 events, or 45.2% of the sample.
- Long hair (20–24 in) led the length dimension at 3,470 events (34.7%), and brown, chocolate, and chestnut shades led color at 3,260 events (32.6%).
The headliners are not bold transformations. They are flattering, familiar directions with a small twist.
Familiar Transformations Won
Look at the top of the individual ranking:
| Rank | Hairstyle | Generations | Share |
|---|---|---|---|
| 1 | Body Wave | 882 | 8.8% |
| 2 | Loose Wave | 701 | 7.0% |
| 3 | Butterfly Cut | 646 | 6.5% |
| 4 | Layered Straight | 628 | 6.3% |
| 5 | Wavy Lob | 564 | 5.6% |
| 6 | Blunt Bob | 537 | 5.4% |
| 7 | Curly | 510 | 5.1% |
| 8 | Water Wave | 473 | 4.7% |
| 9 | Straight | 455 | 4.6% |
| 10 | Deep Wave | 419 | 4.2% |
Four named wave textures appear in the top ten, and a fifth wave-based silhouette — Wavy Lob — sits at number five. The top ten together accounted for 5,815 events, or 58.2% of the sample.
Every one of those directions keeps the person recognizable. Body Wave changes texture but keeps length and color. Butterfly Cut adds layers without touching the silhouette. Layered Straight is straight hair, better distributed. These are the kind of changes a friend would notice and still say "that's so you."
That is a specific finding on its own: when the cost of a risky choice falls to zero, people still spend most of their exploration on changes that stay inside a familiar version of themselves.
Length and Color Follow the Same Line
The same pattern repeats in the two dimensions where change is cheapest to quantify.
| Length | Generations | Share |
|---|---|---|
| Long (20–24 in) | 3,470 | 34.7% |
| Medium (14–18 in) | 2,580 | 25.8% |
| Short (8–12 in) | 1,810 | 18.1% |
| Extra Long (26–30 in) | 1,180 | 11.8% |
| Extra Short (2–6 in) | 960 | 9.6% |
Long and medium combined hit 60.5%. Notice what did not happen: the longest option, Extra Long (26–30 in), was not the favorite. One reading: people explore the length they identify with, not the most extreme version of it.
| Color category | Generations | Share |
|---|---|---|
| Brown / Chocolate / Chestnut | 3,260 | 32.6% |
| Black / Soft Black | 1,980 | 19.8% |
| Blonde | 1,740 | 17.4% |
| Balayage | 1,010 | 10.1% |
| Burgundy / Red | 840 | 8.4% |
| Ombre | 620 | 6.2% |
| Silver / Gray | 320 | 3.2% |
| Other | 230 | 2.3% |
Brown, chocolate, and chestnut appeared in nearly one in three generations; adding black and soft black brings natural dark shades to 52.4%. Silver, gray, burgundy, and ombre — the color changes that actually transform a look — sit at the bottom of the table.
The Experiment Shelf Is Nearly Empty
The catalog includes genuinely bold cuts: Buzz Cut, Bowl Cut, Jellyfish with Blunt Bangs, Hime Cut with Full Bangs, Modern Mullet, and a Micro Fringe Bob. They were all available to generate. They were chosen at the very bottom of the ranking:
- Buzz Cut: 73 events, 0.73%
- Bowl Cut: 82 events, 0.82%
- Jellyfish + Blunt Bangs: 109 events, 1.09%
- Modern Mullet: 146 events, 1.46%
- Hime Cut + Full Bangs: 164 events, 1.64%
These are the styles that would make the avatar look like a different person. That is exactly what they were used for, occasionally and deliberately.
The bottom of the ranking has its own breakdown — the full bottom ten, the structural reasons a style stays rare, and a staged way to test one before you rule it out — in the least tried hairstyles analysis.
Why Zero Cost Does Not Rewrite the Pattern
The dataset records what was generated, not why. Three explanations fit the pattern. Treat them as interpretations, not measured motives.
People use exploration as a way to check a change, not to test their limits. A wave or a bob answers a concrete question — would I like more texture? would a shorter silhouette work? — while a buzz cut answers a question almost nobody carries: who would I be at an inch long?
The recognizable change is still a change. Butterfly Cut and Layered Straight are not "no change." They are changes that preserve identity while updating the look. People who want to look different but look like themselves cluster on those directions.
Experimental styles function as curiosity, not candidates. Jellyfish, mullet, and hime cuts probably get generated to see the result, laugh, and move on. They are exploration as entertainment inside a smaller, earlier stage of the journey.
One hypothesis explains the whole pattern: low-commitment exploration lowers the cost of trying, but it does not lower the mental price of seeing yourself as someone else. The risk that keeps people safe is visual identity, and a free try-on does not change that.
That hypothesis is supportable but not measured. The measured fact is the distribution itself.
What This Does Not Prove
This finding is easy to overstate, and we want to be explicit about the boundaries:
- A generation is not a preference. People generate looks they never intend to wear, especially when curiosity is the driver.
- Catalog structure influences counts. A family with more available variations accumulates more generations. These numbers describe behavior inside the WigTryAI catalog, not the world's taste.
- Repeat generations are included. One person may generate several looks in one session, so the data cannot be read as 10,000 independent opinions.
- The dataset contains no surveys. There is no self-reported reason for any choice, so the interpretations above are hypotheses, not conclusions.
- The results are not population-wide. They describe exploration inside one AI try-on product during the dataset snapshot published July 22, 2026.
For the full methodology, sample description, and limitations, read the 2026 AI Hairstyle Trends Report.
What This Means for a Real Decision
The useful lesson is about your own exploration pattern, not about what everyone else picks.
If you have been testing the same few directions for months, notice that the data says you are in the majority. The people who pushed the avatar into a buzz cut do not know anything about long hair that you do not. The next step is not to copy the leaders — it is to use the tool the way the data says it works: as a comparison machine, not a popularity list.
Start with what you already feel drawn to, then change one variable at a time. Keep the same photo and the same color. Change the texture. Then the length. Then the color. The version of yourself that appears at the end of that process is a decision you made, not a trend you followed.